Brexit, things are easy
Today something historic happened – ‘seismic’ someone told – something that probably will impact my life, and the life of my sons and probably their sons. As we all know, the UK has chosen to leave – or Brexit – the European Union.
I moved to UK three years ago, with the family, thanks to the fact that being Italian/European all I had to do was to pack all my stuff, catch a plane and move to London, where I found a job, a house and a school for my kids, everything in a couple of months.
I’ve spent the whole day asking myself: “what happened?”, how comes that the English people have chosen to shoot in their foot, despite being told by everyone that it was an extremely dangerous and self-harming route? How comes that they have listened – and believed – to people that promised them “350 millions per week to give to NHS” or that out of the Europe everything will magically work out? People that told them that things are easy, everything is black or white (or blue and yellow). You’re in or you’re out. You’re immigrant or “native”. You’re good or bad.
Are those people all dumb?
But then in the aftermath I have seen people telling or posting that “well Scotland and London now should ask for the independence, because look at the graphs”. The graph is this one:
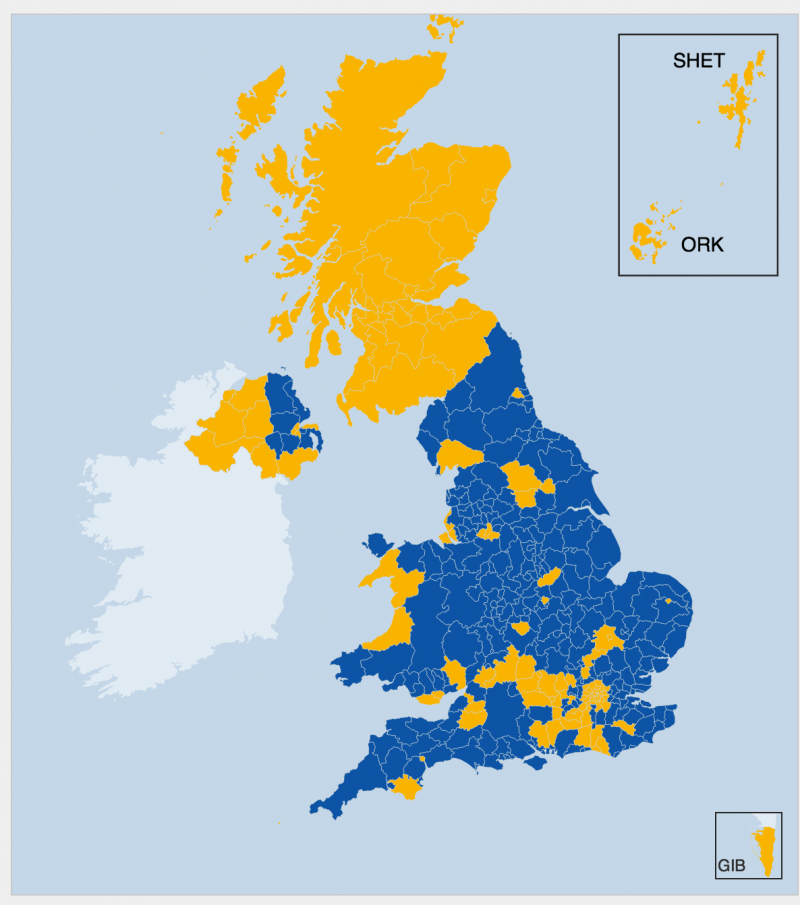
This in particular is taken from the BBC website (but there are many other ones, similar, on all the other news websites). And shows the areas where “remain” (yellow) and “leave” (blue) are majority.
There was something that didn’t work for me in this image. Something I could not understand at the very beginning. But then I realised that things are more complex than black or white, yellow or blue. That is not true that London is all yellow as it looks like and the solution will not be to think that now London can ask to join the EU. If you (and I) think that this is the way out of this total mess, well we are as dumb as those that believed that now magically there will be more money for the NHS every week and no more immigrants, starting from tomorrow.
And my mind of “designer” made me think of how I tend to overlay colours and opacities in Photoshop (os Sketch) when I want to mix them. And I thought that I wanted to see the same map, but with the real overlay of colours: 60% of yellow and 40% of blue where people voted 60% vs 40%. So I grabbed the HTML page and the SVG chart from the website, I downloaded the results data from the Electoral Commission and I used the CSS opacity to overlay blu and yellow areas.
The result is this (unfortunately I don’t have disaggregated data for Northen Ireland):
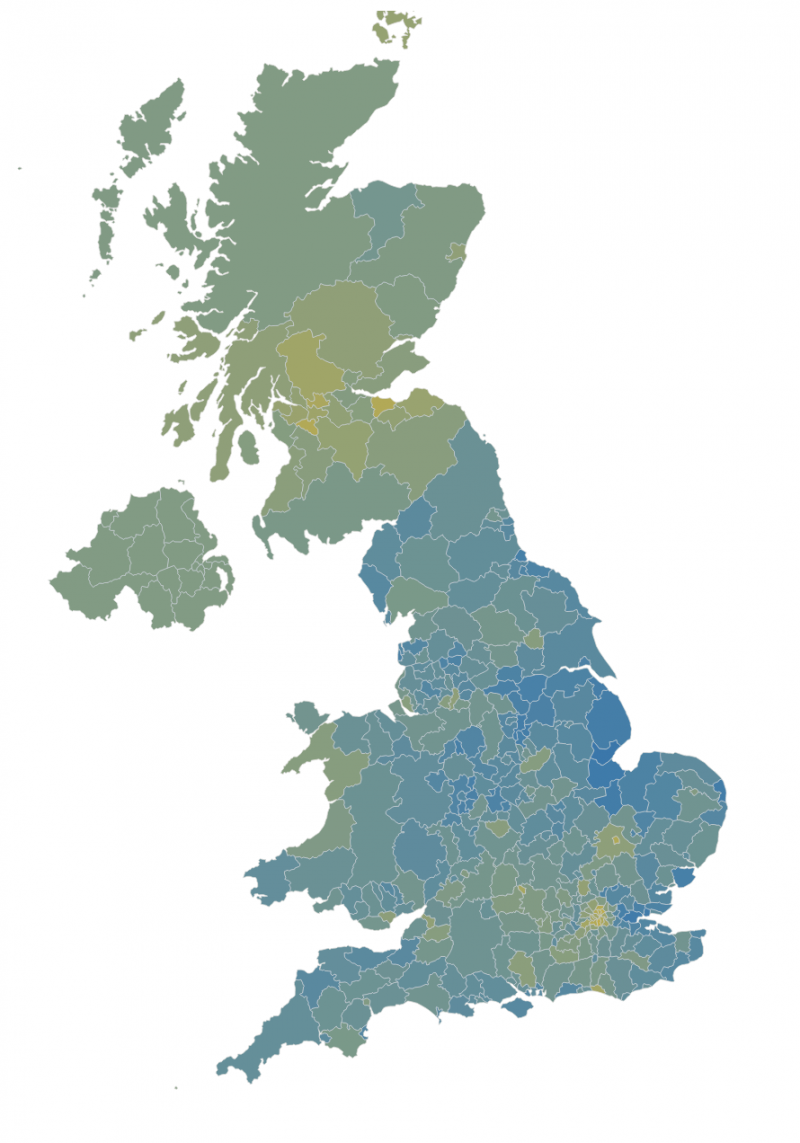
Now you see thing as they are in reality: more complex than what you imagine (or want to believe). No, there is no clear indication where to put a border, where to build a wall, where people wants to stay in EU and should do a counter referendum to split from the UK. No, London is not so different from Sheffield or Manchester or Edinburgh or Cardiff.
If there is something I have learnt in my life is that things are never, never, black or white. And that whenever I start to think in this way I have to stop myself, take a deep breath, and rethink and look at what I am missing, where I am taking a mental shortcut, to judge in the blink of an eye instead of try to understand what are the other points of view. Often where is the catch, the deception, the scam.
Tomorrow is a new day. And the years in front of us probably will not be easy. Surely not simple. But there are no “and here magic happens” that can solve the situation: no simple roads, no shortcuts to take, no “London will join the EU”.
Sorry.
Patch: I have updated the image because – damn CSS! – I had inverted the colurs for remain/leave. They were in hexadecimal value. Things are never easy, not even CSS colours.
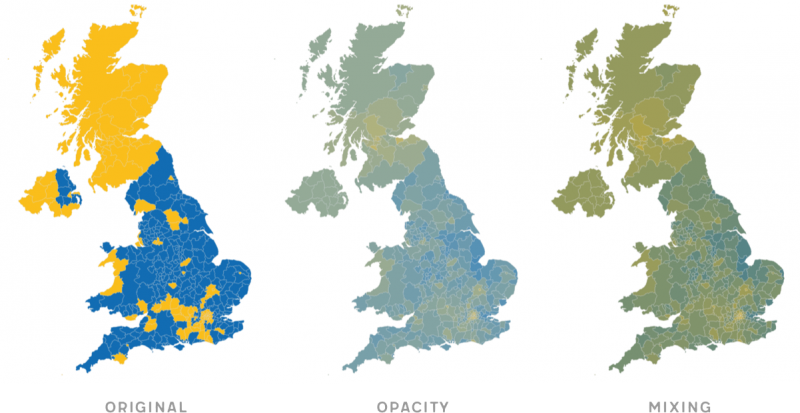
Update: out of curiosity I have done a new version, using a color mix function instead of the opacity. Here the result and the comparison with the previous version.